
Quick answer
Direct answer
What you will learn
- The minimum viable CTEM metric set
- The difference between operational and outcome metrics
- How each metric can be misused
- How to report to program, leadership, and board audiences
- How to set targets that are achievable and honest
Explanation
Fewer is more
The minimum viable metric set
| Metric | Type | What it shows | How it can be misused |
|---|---|---|---|
| Critical exposure count on top services | Outcome | Current attack surface that matters most | Comparing across services with different criticality |
| Mean exposure age at closure | Operational | Program speed on validated exposures | Reporting average without median; a few outliers hide the reality |
| Validated exposure rate | Operational | Share of the register that has been proven vs assumed | Validating easy items to inflate the rate |
| Remediation SLA performance | Operational | How often SLAs are met, per severity band | Loosening SLAs to hit the target |
| Reopened exposure rate | Operational | Quality of remediation and validation | Excluding exceptions from the base to look better |
| Exception count and age | Operational | How much accepted risk is on the books | Using exceptions as a permanent workaround |
| Risk reduction trend on top services | Outcome | Whether CTEM is actually reducing business risk | Reporting one point instead of a trend |
Operational vs outcome metrics
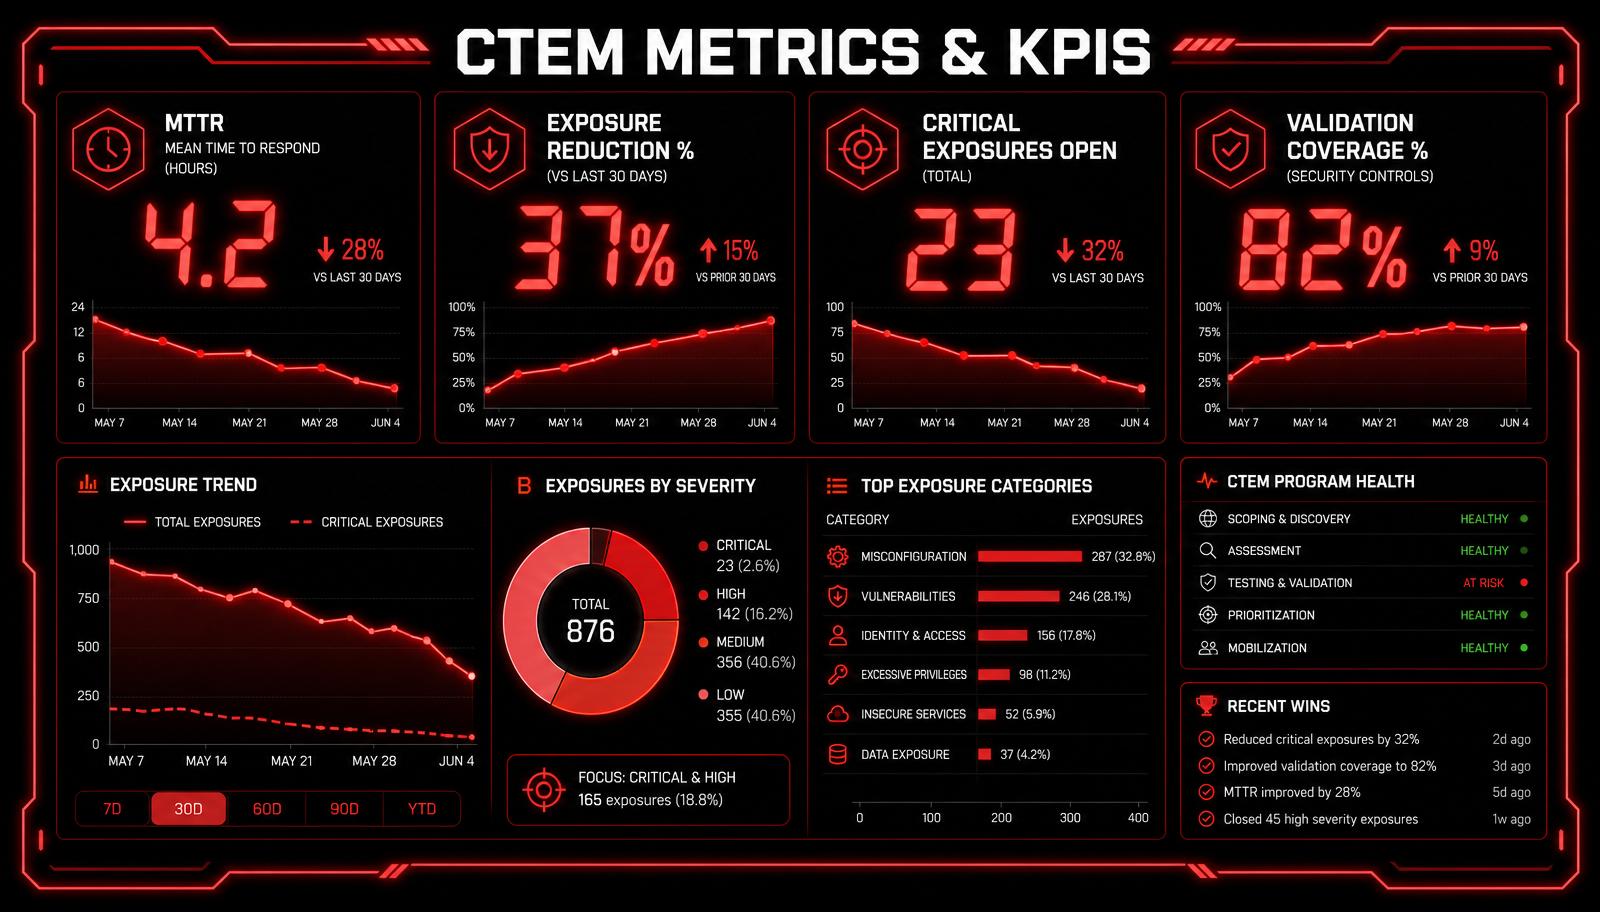
Operational metrics tell you whether the loop is running. Outcome metrics tell you whether the loop is producing anything for the business. A healthy dashboard has both. Reporting only operational metrics tells leadership how busy the team is, not whether risk is going down.
| Type | Question it answers | Audience |
|---|---|---|
| Operational | Is the CTEM loop running well? | Program team, security leadership |
| Outcome | Is business risk going down? | Security leadership, executive leadership, board |
Reporting cadence by audience
| Audience | Cadence | What they see |
|---|---|---|
| Program team | Weekly | Full operational and outcome set, with drill-down |
| Security leadership | Monthly | Trend on all metrics, exceptions, top escalations |
| Executive leadership | Quarterly | Outcome metrics on top services, exceptions, program investments |
| Board | Quarterly or semi-annual | Risk trend on top services, program maturity level, headline exceptions |
Setting targets
Targets should be honest and achievable, not aspirational. A good pattern is to baseline in the first cycle, then set improvement targets against the baseline for each subsequent cycle. Common patterns:
- Reduce critical exposure count on top services by a defined percentage each quarter.
- Keep validated exposure rate above a defined floor for all critical items.
- Keep mean exposure age at closure below a defined ceiling, reported as median and average together.
- Keep reopened exposure rate below a defined ceiling.
- Keep exception age within a defined limit; force review at expiry.
Metrics that look useful but are not
| Metric | Why it looks useful | Why it fails |
|---|---|---|
| Total open findings | Big number, easy to chart | Without asset context, more findings is not more risk |
| Scanners run per week | Shows tool activity | Activity is not outcome |
| Tickets opened | Shows team is busy | Opening more tickets does not reduce risk |
| Average CVSS score | Feels quantitative | Ignores exploitability, reachability, and asset importance |
| Coverage percentage without scope definition | Sounds thorough | Denominator drift makes trends meaningless |
A short reporting example
A monthly report to security leadership on the checkout service could read: critical exposure count trending down over three cycles, mean closure age within target, validated exposure rate above the floor, one SLA breach explained, two exceptions active with expiry dates, and one recommended investment for the next cycle. That fits on one page.
For more detail on report structure, see CTEM Metrics and Reporting. For roles that consume these metrics, see CTEM Roles and Responsibilities.
How to apply this
- Adopt the minimum viable metric set for the next cycle
- Baseline each metric before setting targets
- Report median alongside average for age metrics
- Publish a one-page report per audience at the agreed cadence
- Retire any metric that has not driven a decision in three cycles
Common mistakes
- Reporting activity metrics to leadership
- Comparing critical exposure count across services without normalization
- Loosening SLAs to hit the target
- Using exceptions as a permanent workaround
- Adding metrics faster than they can be defined
Key takeaways
- A minimum viable CTEM metric set is five to seven metrics.
- Operational and outcome metrics both belong on the dashboard.
- Audience determines cadence and level of detail.
- Targets should be baselined before they are set.
- Any metric that cannot drive a decision should be retired.
Frequently asked questions
Related pages
CTEM Framework
CTEM Framework: The Complete Operating Model Explained
The full CTEM framework: five stages, inputs, outputs, roles, cadence, and how scope, discovery, prioritization, validation, and mobilization connect.
CTEM Roles and Responsibilities
CTEM Roles and Responsibilities: Who Does What in the Program
A simple RACI-style view of CTEM roles across security, IT, cloud, application, identity, risk, and leadership teams.
How to Start a CTEM Program
How to Start a CTEM Program: A 30/60/90-Day Roadmap
A practical 30/60/90-day roadmap for starting a CTEM program: what to do first, what to avoid, how to choose scope, and how to show early progress.
Metrics & Reporting
CTEM Metrics and Reporting: What to Measure and Share
Operational metrics, risk reduction metrics, executive reporting, board reporting, and common CTEM reporting mistakes to avoid.
Next step
Next: How to start a CTEM program
Turn the metric set into a 30/60/90-day plan.
Author
LearnCTEM Editorial Team
Practitioners and educators writing plain-English guides on Continuous Threat Exposure Management.
Reviewed by
Senior CTEM Practitioner Panel
Reviewed for accuracy against public CTEM guidance and real-world program experience.
Sources and further reading
- ▸Gartner, Implement a Continuous Threat Exposure Management (CTEM) Program (2022). Frames CTEM measurement around outcomes rather than activity.
- ▸NIST SP 800-55, Performance Measurement Guide for Information Security. Public guidance on operational and outcome-based security metrics.