

What you will learn
- Why finding counts fail in the boardroom
- The five metric set that works
- How to calculate exposure half life
- How to express reachability so executives care
- How to report coverage honestly
- How to make accepted risk visible
- How to present a quarter in one page
Explanation
Finding counts answer a question nobody asked
A slide saying the organisation has 412,000 open vulnerabilities tells an executive nothing they can act on. It does not say whether the business is safer than last quarter, whether the most valuable systems are protected, or whether the money already spent is working. Worse, the number usually goes up when coverage improves, which punishes the programme for doing the right thing. Replace it with metrics that describe risk and time.
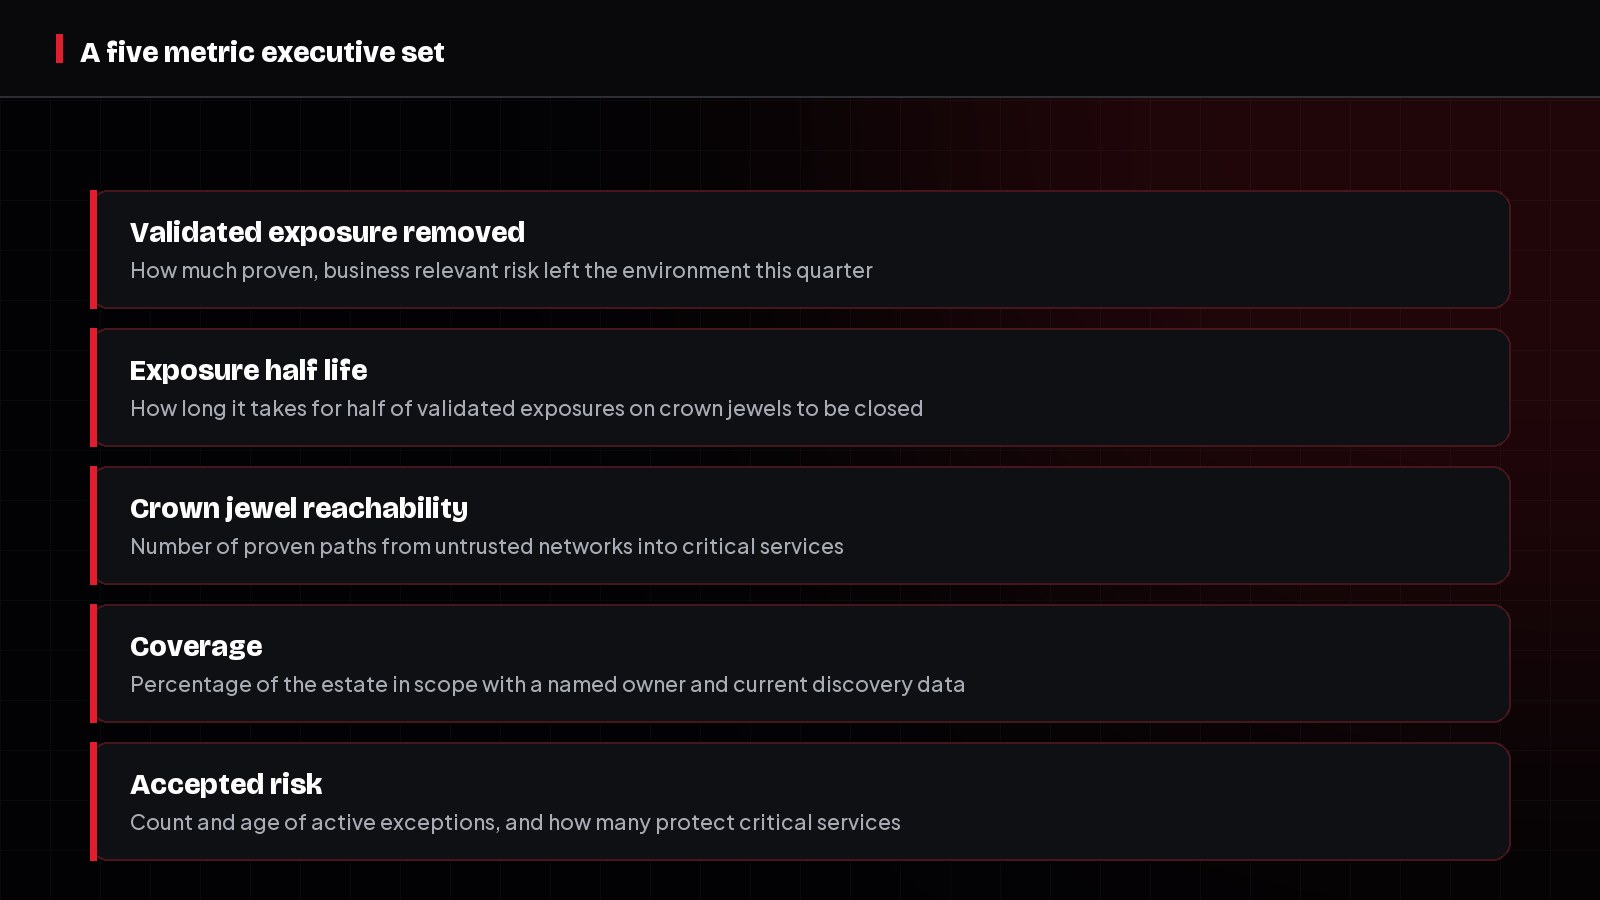
Metric one: validated exposure removed
Count only exposures that were proven exploitable through validation, sat on a business relevant asset, and were then closed with a retest. This is deliberately a small number. Its value is that every unit is defensible, and the trend line answers the only question that matters: is proven risk leaving the environment faster than it arrives?
Metric two: exposure half life
Half life is the time it takes for half of the validated exposures opened in a period to be closed. It is more honest than an average, because a small number of very old items cannot be hidden by a pile of quick wins, and it is intuitive to anyone who has seen a decay curve. Calculate it per risk tier, since a 14 day half life on crown jewels and a 90 day half life elsewhere is a reasonable programme, whereas a single blended figure hides both.
| Metric | Formula | Healthy direction |
|---|---|---|
| Validated exposure removed | Count of validated, business relevant exposures closed with retest, per quarter | Rising then stabilising as intake falls |
| Exposure half life | Days until 50 percent of the cohort opened in a period is closed | Falling, reported per risk tier |
| Crown jewel reachability | Count of proven paths from untrusted networks into tier one services | Falling toward zero |
| Coverage with ownership | Assets in scope with current discovery data and a named owner, divided by total assets in scope | Rising toward 100 percent |
| Accepted risk age | Number of active exceptions and their median age in days | Stable count, falling median age |
Metric three: crown jewel reachability
This is the metric that produces the most useful boardroom conversation, because it is stated in plain terms: there are currently four proven ways an attacker on the internet can reach the customer payments platform, down from eleven. It requires attack path analysis and validation to produce, which is exactly why it is credible.
Metric four: coverage with named ownership
Coverage is often reported as scan percentage, which overstates confidence. The stronger version pairs discovery freshness with accountability: an asset counts as covered only if the data is current and a named team is accountable for fixing things on it. Unowned assets are then visible as a governance problem, which is what they are.
Metric five: accepted risk age
Every organisation carries risk it chose not to fix. Hiding that inside a compliance percentage is what makes it dangerous. Report how many exceptions are active, how many protect tier one services, how many have validated compensating controls, and how many are past their review date. That last figure is usually the clearest indicator of whether governance is real.
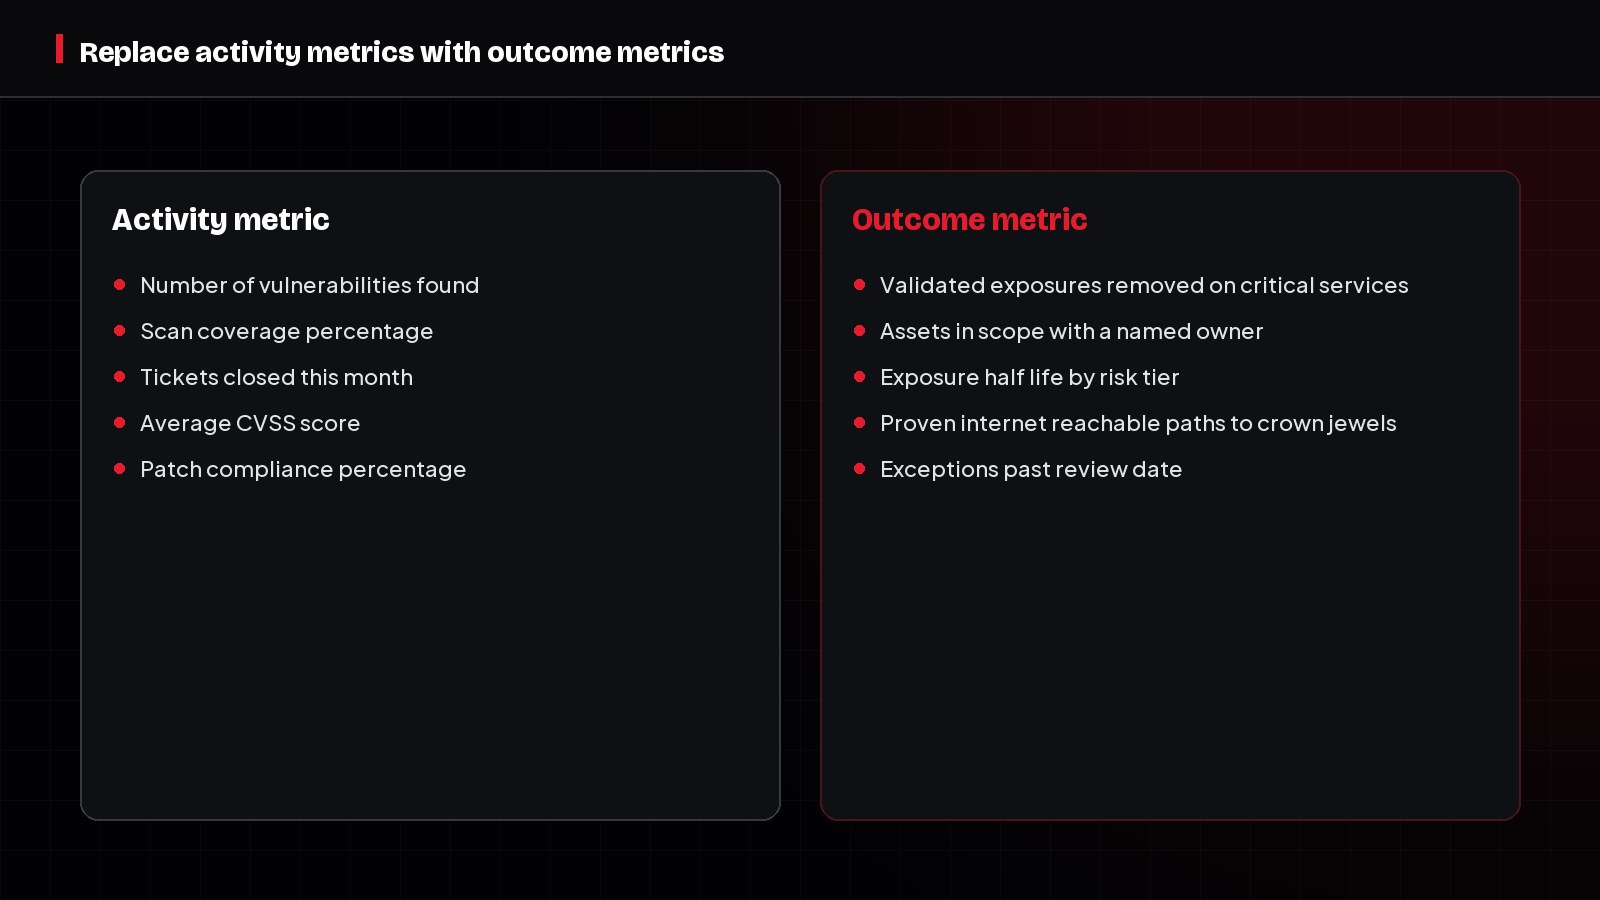
Retire the activity metrics deliberately
Do not simply add the new metrics next to the old ones. Whatever appears on the slide is what teams optimise for, so leaving finding counts in place keeps the old incentives alive. Announce the swap, explain why, and keep the operational metrics for the team's own use.
One page per quarter
Executive reporting should fit on a single page: the five metrics with their trend, one sentence on what changed, the two or three decisions you need from the leadership team, and the risks you are formally accepting. Everything else belongs in an appendix that most readers will never open, which is fine.
How to apply this
- Pick the five metrics and publish their definitions so nobody argues about them later.
- Calculate half life per risk tier rather than blended across the estate.
- Report crown jewel reachability as a plain sentence, not a score.
- Count an asset as covered only when it has current data and a named owner.
- Put exceptions past their review date on the executive page every quarter.
Common mistakes
- Reporting raw finding counts, which rise when coverage improves.
- Using averages instead of half life, which hides very old items.
- Reporting scan coverage as if it proved accountability.
- Adding outcome metrics while keeping activity metrics on the same slide.
- Leaving accepted risk out of the executive report entirely.
Frequently asked questions
Related pages
CTEM Metrics Executives Care About
CTEM Metrics Executives Actually Care About
The CTEM metrics that hold attention in a board room: validated exposure reduction, time to remediate what matters, coverage, and repeat exposure rate.
CTEM Operating Model
The CTEM Operating Model: Roles, Rhythm, Governance
How to structure a CTEM programme that runs without heroics: six roles, a daily to quarterly rhythm, decision rights, escalation paths and governance evidence.
Compensating Controls in CTEM
Compensating Controls in CTEM: When You Cannot Patch
How to use compensating controls in CTEM: five options when patching is impossible, validating that a control blocks the technique, and writing a defensible exception.
Earn your free CTEM certification.
Ready to prove your CTEM knowledge? Start with the free LearnCTEM Beginner Certification, continue with the Practitioner Certification, and build toward Program Leader. Every LearnCTEM certificate is free, vendor-neutral, and publicly verifiable at LearnCTEM.com.
Beginner / Practitioner / Program Leader
Explore certificationsAuthor
LearnCTEM Editorial Team
Practitioners and educators writing plain-English guides on Continuous Threat Exposure Management.
Reviewed by
Senior CTEM Practitioner Panel
Reviewed for accuracy against public CTEM guidance and real-world program experience.